
Introduction
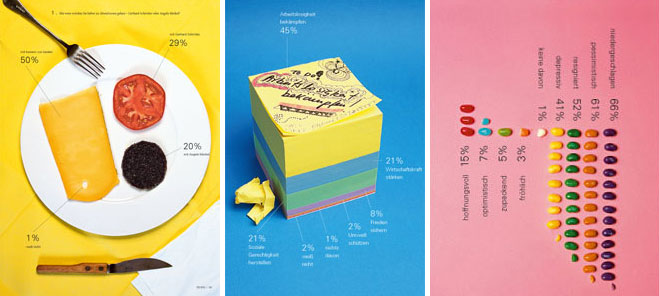
Data is a compilation of information that can sometimes be challenging to understand. Traditionally, data visualizations are arranged in structured or numerical ways. However, there are simpler, more effective methods to convey it. Sarah Illenberger is a prime example of how one can represent data in a less conventional but more understandable manner. Renowned for her unique approach to visual storytelling, Illenberger creatively juxtaposes ordinary items to communicate important information.
Power of Visual Mapping
Visual mapping can significantly distill complex data by introducing patterns, shapes, and colors that already make sense to us. With visual aids, elaborate data patterns can become more digestible and more accessible to recognize. This simplification helps with quick comprehension, allowing individuals to make informed decisions based on facts (Interaction Design Foundation).
Why is it important?
But why do patterns, shapes, and colors help anyway? Patterns and shapes provide a visual rhythm, while colors create contrast and evoke emotions:
“Our eyes are drawn to colors and patterns. We can quickly identify red from blue and squares from circles. Our culture is visual, including everything from art and advertisements to TV and movies. Data visualization is another form of visual art that grabs our interest and keeps our eyes on the message” (Tableau).
As our eyes naturally gravitate towards these visual cues, we can find ourselves easily differentiating the language of data interpretation.
Elements of a good visualization
To create a practical or “good” visualization, one must include four fundamental pillars: information, story, goal, and visual form. The strengths of any visualization will lie in:
- How informative it is
- How compelling the narrative is
- How visually appealing it is
Together, these pillars form the basis for creating visualizations that communicate complex data with clarity and effectiveness. (McCandless, 2014).
The Project

Inspired by Illenberger’s work, I wanted to create a visualization that encapsulated using everyday objects to visualize data. In this unique activity, I transformed data on dental caries across various age groups into an artistic piece. By carefully arranging glasses filled with candy, I represented the prevalence of dental caries across different age groups in the United States. This activity allowed me to delve into the world of visual mapping, allowing me to see the impact of data when presented in a creative format.
Qualitative or Quantitative
This data was quantitative rather than qualitative; however, it is represented more qualitatively. Using candy and clear glasses to visualize this data makes it less numeric and more subjective.
Objects & Arrangements
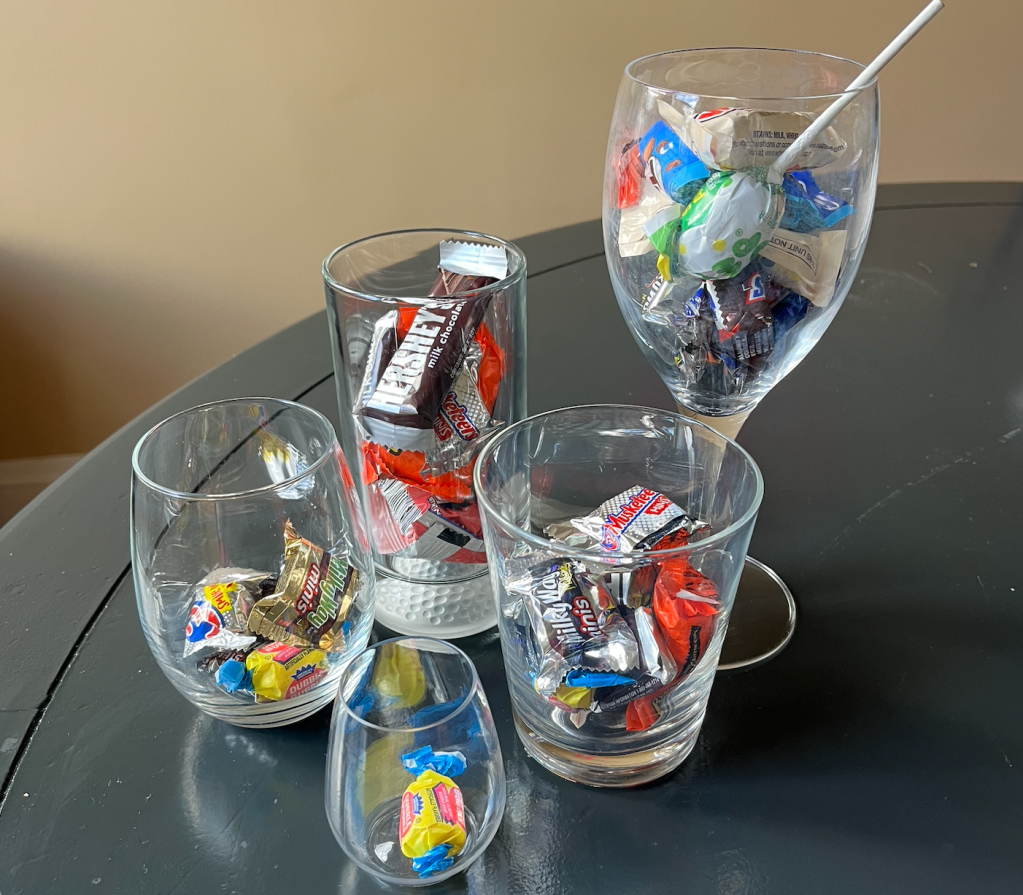
Using everyday objects to visualize chosen data is a creative and innovative approach. Adding tangible objects to a visualization simplifies the dataset while making it more relatable for the audience. The importance of composition and scale are notable factors that should be addressed when arranging these objects. For example, when setting up the glasses of candy, it was important that they were laid out in a line rather than grouped together. In a grouping, it is harder to tell what size each glass is and how much it is filled with candy. When arranged in a line, one can easily distinguish each glass’s volume and how much it is filled with candy. A well-thought-out composition will ensure the visual impact is aesthetically pleasing and communicatively effective.
Conclusion
Sarah Illenberger’s work provided me with a rewarding opportunity to improve my visual storytelling. Through the strategic use of patterns, shapes, and colors coupled with using everyday objects to visualize my data, I gained insights into making information more engaging and accessible. This hands-on experience not only improved my visual storytelling skills but also encouraged me to explore my creative thinking. I invite readers to learn from Illenberger’s work themselves and embark on their own journey to making a visually compelling narrative.

Leave a comment